Daily anchorage congestion counts, port by port.
See the roads fill up without waiting on the agent's report.
A daily count of vessels at anchor outside your port, kept as a congestion series, so you can read demurrage exposure while the queue forms.
- GSD
- High / 0.5–2 m
- Cadence
- Daily
- Platform
- High-resolution satellite
- Spectral
- RGB
01The job today
The report arrives after the queue has moved
You have a cargo loading or discharging at a port with a line of ships outside it. The agent emails an update: vessels in the roads, a berthing expectation, the next nomination. You put that beside the notice of readiness and the laytime clause in the charter party and work out how much of the wait lands on your side. Then the owner's operator asks for the same figure, and the agent's next report says the picture has changed.
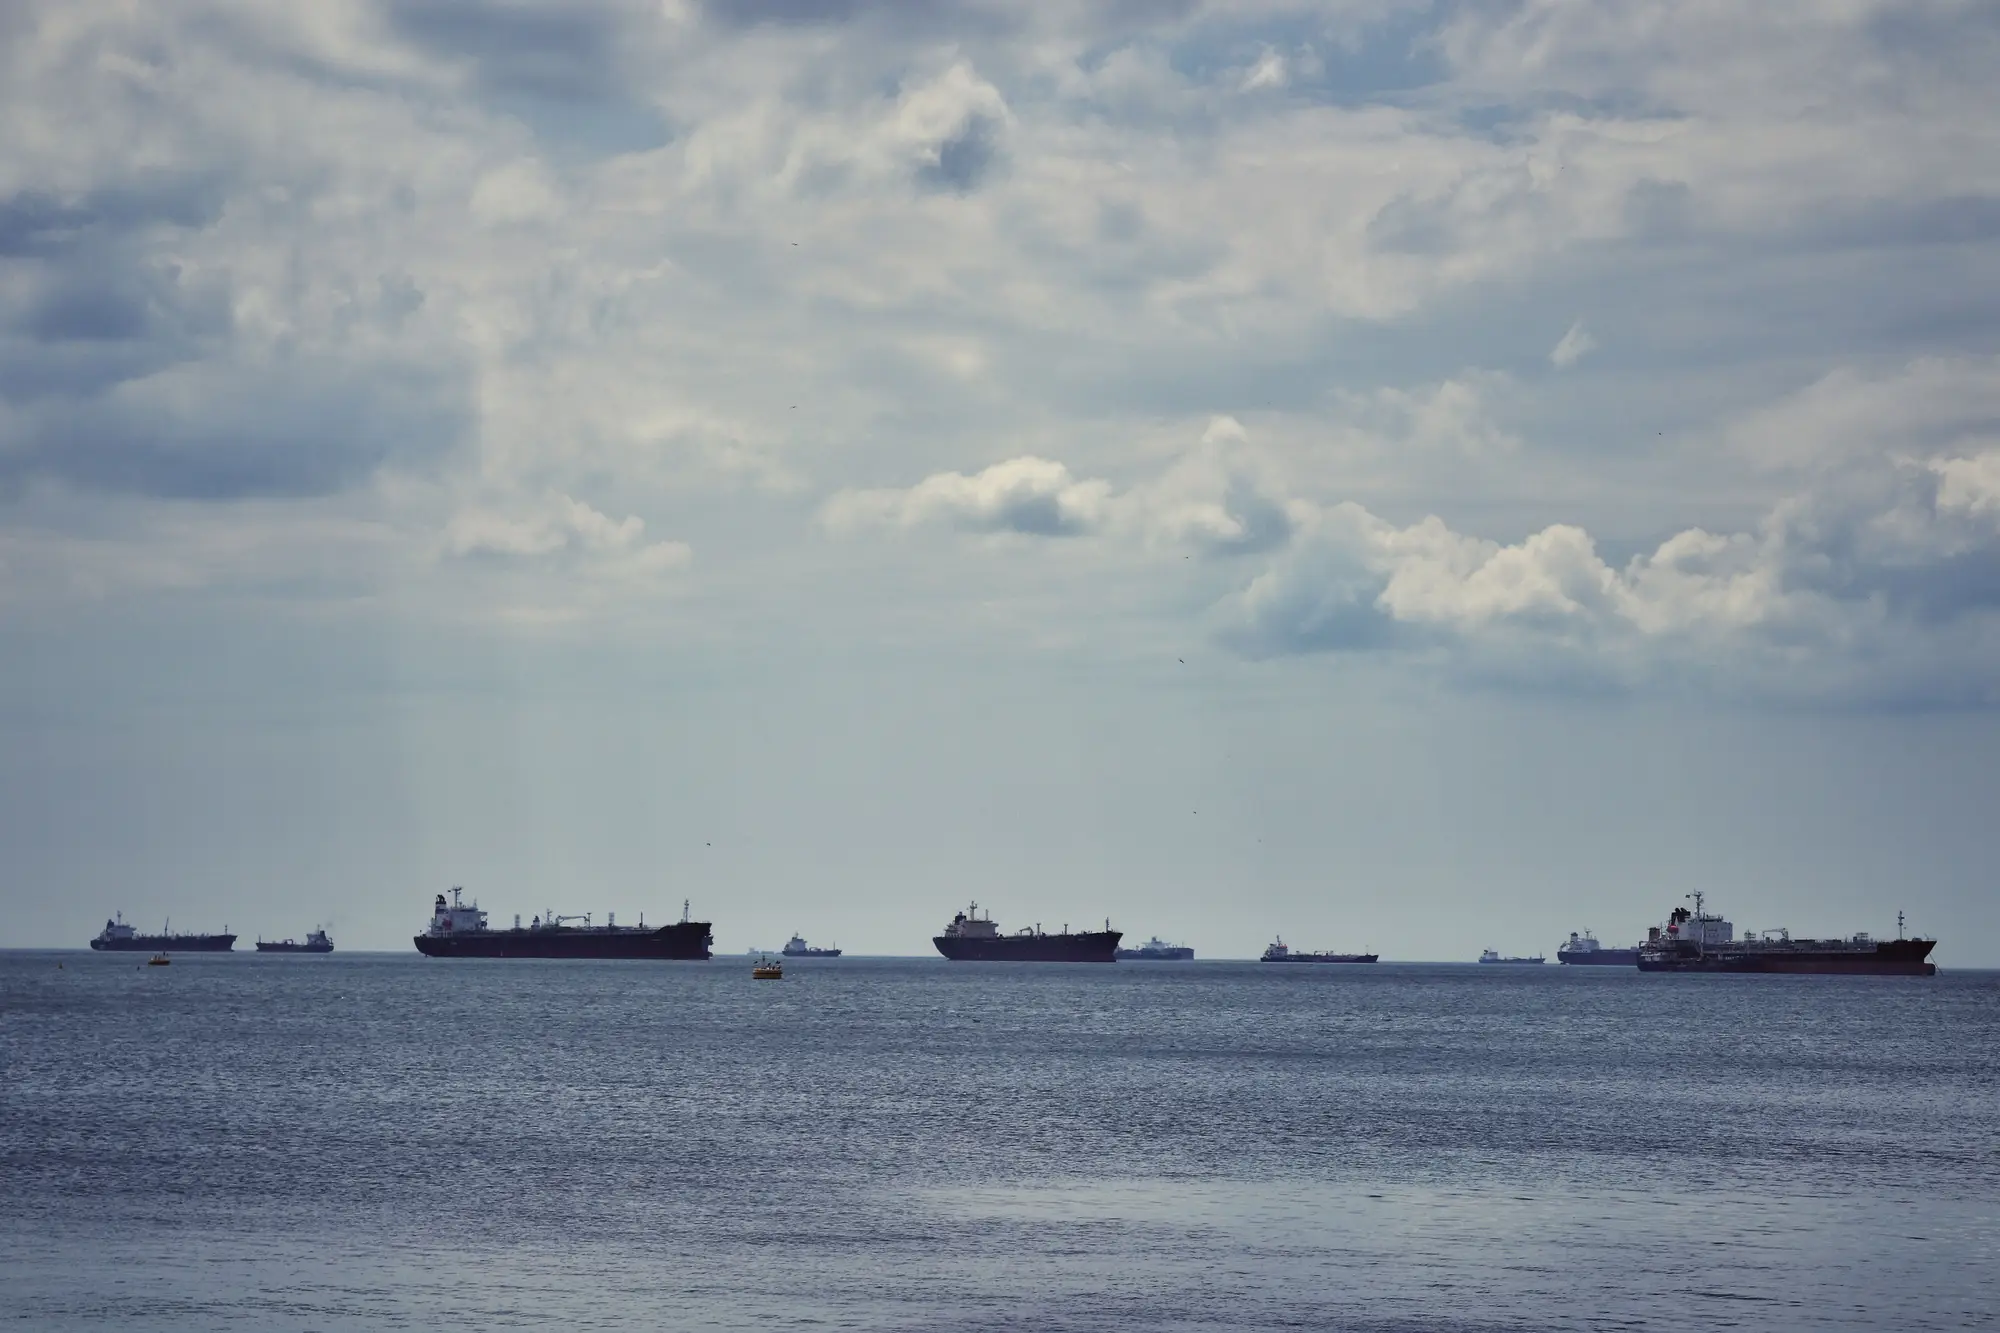
Nobody in that chain is lying to you. The agent is reporting what they know, from where they sit, on their own schedule. What you lack is a count of your own, taken the same way every day, that you can line up against the agent's words. Without one, you only find out how long the queue was when the statement of facts and the demurrage claim turn up after the port call. A trader choosing between two load ports has the same gap, with less time to fill it.
This page sells the count. A daily tally of vessels at anchor, from satellite passes over the anchorage, kept as a series so you can see the line rise or fall. You keep your agent and your charter party. The series gives you something to check the agent's report against.
02What you get
What lands each day
One set of files per port you name, every day of the project. Open them in the spreadsheet or voyage tool the desk already uses.
2.1Daily count of vessels at anchor Daily count
For each day, the number of vessels counted at anchor inside your anchorage boundary. It's the number to set beside the agent's report.
2.2Congestion series CSV
The daily counts as one file, one row a day, with gaps marked where cloud hid the anchorage. It opens in a spreadsheet or loads into your voyage sheet, so you can chart the queue building or clearing across the days of the port call.
2.3Dated overlay image Image
The day's image of the anchorage with each counted vessel marked. When the count gets queried, by the agent, the owner or your own claims team, you can point at what was counted.
2.4Vessel names, if you supply AIS Add-on
On its own the series is a position count and never gives a vessel name. If you send an AIS feed, counted vessels can be matched against it, so you can see which ships are the ones waiting.
03
How it works
Before the first pass
3.1Name the port and the anchorage boundary
Send the port and the boundary you count inside, ideally the one your charter party refers to. If you don't have one, say which anchorage the agent reports on and we'll talk it through.
Every day
3.2Daily pass over the anchorage
Repeat high-resolution satellite passes over the anchorage.
Every day
3.3Vessels at anchor counted
Vessels inside the boundary are detected and counted. The count is checked across the repeat passes so a ship underway through the boundary doesn't get logged as waiting.
Every day
3.4Series delivered
The day's count is added to the CSV and the dated overlay image goes with it.
04
Where it fits
- Demurrage exposure on open charters. The series gives you a running reading of the queue to set against each laytime clause and notice of readiness.
- Choosing between load or discharge ports. Two congestion series for competing ports, side by side, before you nominate.
- A check on the agent's report. The count is yours, from a different source, taken the same way each day.
05
Limits
- L1
Cloud leaves gaps
Optical imagery needs a clear view of the anchorage. On a day of heavy cloud there may be no usable pass, and that day appears as a gap in the series, not as a zero and not as an estimate.
- L2
A count, not a queue order
The series tells you how many vessels are present. It doesn't say who is next, when the berth frees up or when a particular ship will be alongside. Berth allocation sits with the port and the agent.
- L3
Resolution sets what's counted
At 0.5–2 m per pixel a cape or a handy-size bulker is long enough to show up. Small craft such as tugs and pilot boats are marginal at the coarse end, and the series is about ships waiting for a berth. The count doesn't tell you a vessel's type or cargo.
- L4
No names without AIS
The count has positions, not identities. A vessel name appears only where you've given us an AIS feed to match against.
- L5
Daily is the target
We aim at a daily count. Weather, satellite tasking and the clear-sky window can all put a day late or missing, and we don't promise a delivery hour.
- L6
Your boundary, your dispute
We count inside the boundary you give us. If a charter party dispute turns on where the anchorage begins, check that our boundary is the one the contract refers to before you rely on the count.
06
Who it's for
For
- A charterer or commodity trader with cargoes loading or discharging at a specific port and a demurrage bill to think about.
- A voyage operator or laytime analyst who wants a count of their own next to the agent's report.
- A freight desk comparing the queues at competing ports before it nominates one.
Not for
- A buyer after an ETA, a berthing date or a place in the queue. The series counts vessels present and nothing downstream of that.
- An owner or manager tracking one named vessel. That takes AIS on its own terms.
- A desk that expects a demurrage figure worked out for it. The count is an input to your laytime statement.
07FAQ
Questions from chartering and operations
Does it give me an ETA or a berth date?
No. It counts vessels present at the anchorage. It doesn't model berth allocation or queue order.
Does it identify vessels by name?
Only where you supply an AIS feed to match against. On its own it's a position count.
Does weather affect the daily count?
Yes. Cloud can cost a day, and the series shows it as a gap. Nothing is filled in.
Can you use the anchorage boundary from my charter party?
Yes, we map to the boundary you define. Check that it matches what your charter party references, because the count is only as good a reference as that boundary.
How do we check it against the agent's report?
Put the daily count next to the agent's queue figure for the same days. The dated overlay image shows which vessels were counted, so a mismatch can be talked through against a picture.
Can you track more than one port?
Yes. Name each port and boundary and each gets its own series.
Does it plug into our voyage system?
There's no direct integration. You get a CSV that opens in a spreadsheet or loads into anything that takes CSV, and images to attach to your file.
Can we use the images in a claim or a dispute?
What you can do with the files, and the licence on the satellite imagery behind them, gets written into the project agreement before the first day runs. Take it up with your own claims team as well.
How is it priced?
It depends on the ports and the period, so we quote once we know both. There's no price list on this page.
Name a port, see the count.
Send the port and the anchorage boundary from your charter party, and tell us how long you need the series. We'll scope the daily run from there.
Start a project