Weather hold or real queue? Reading an anchorage count spike
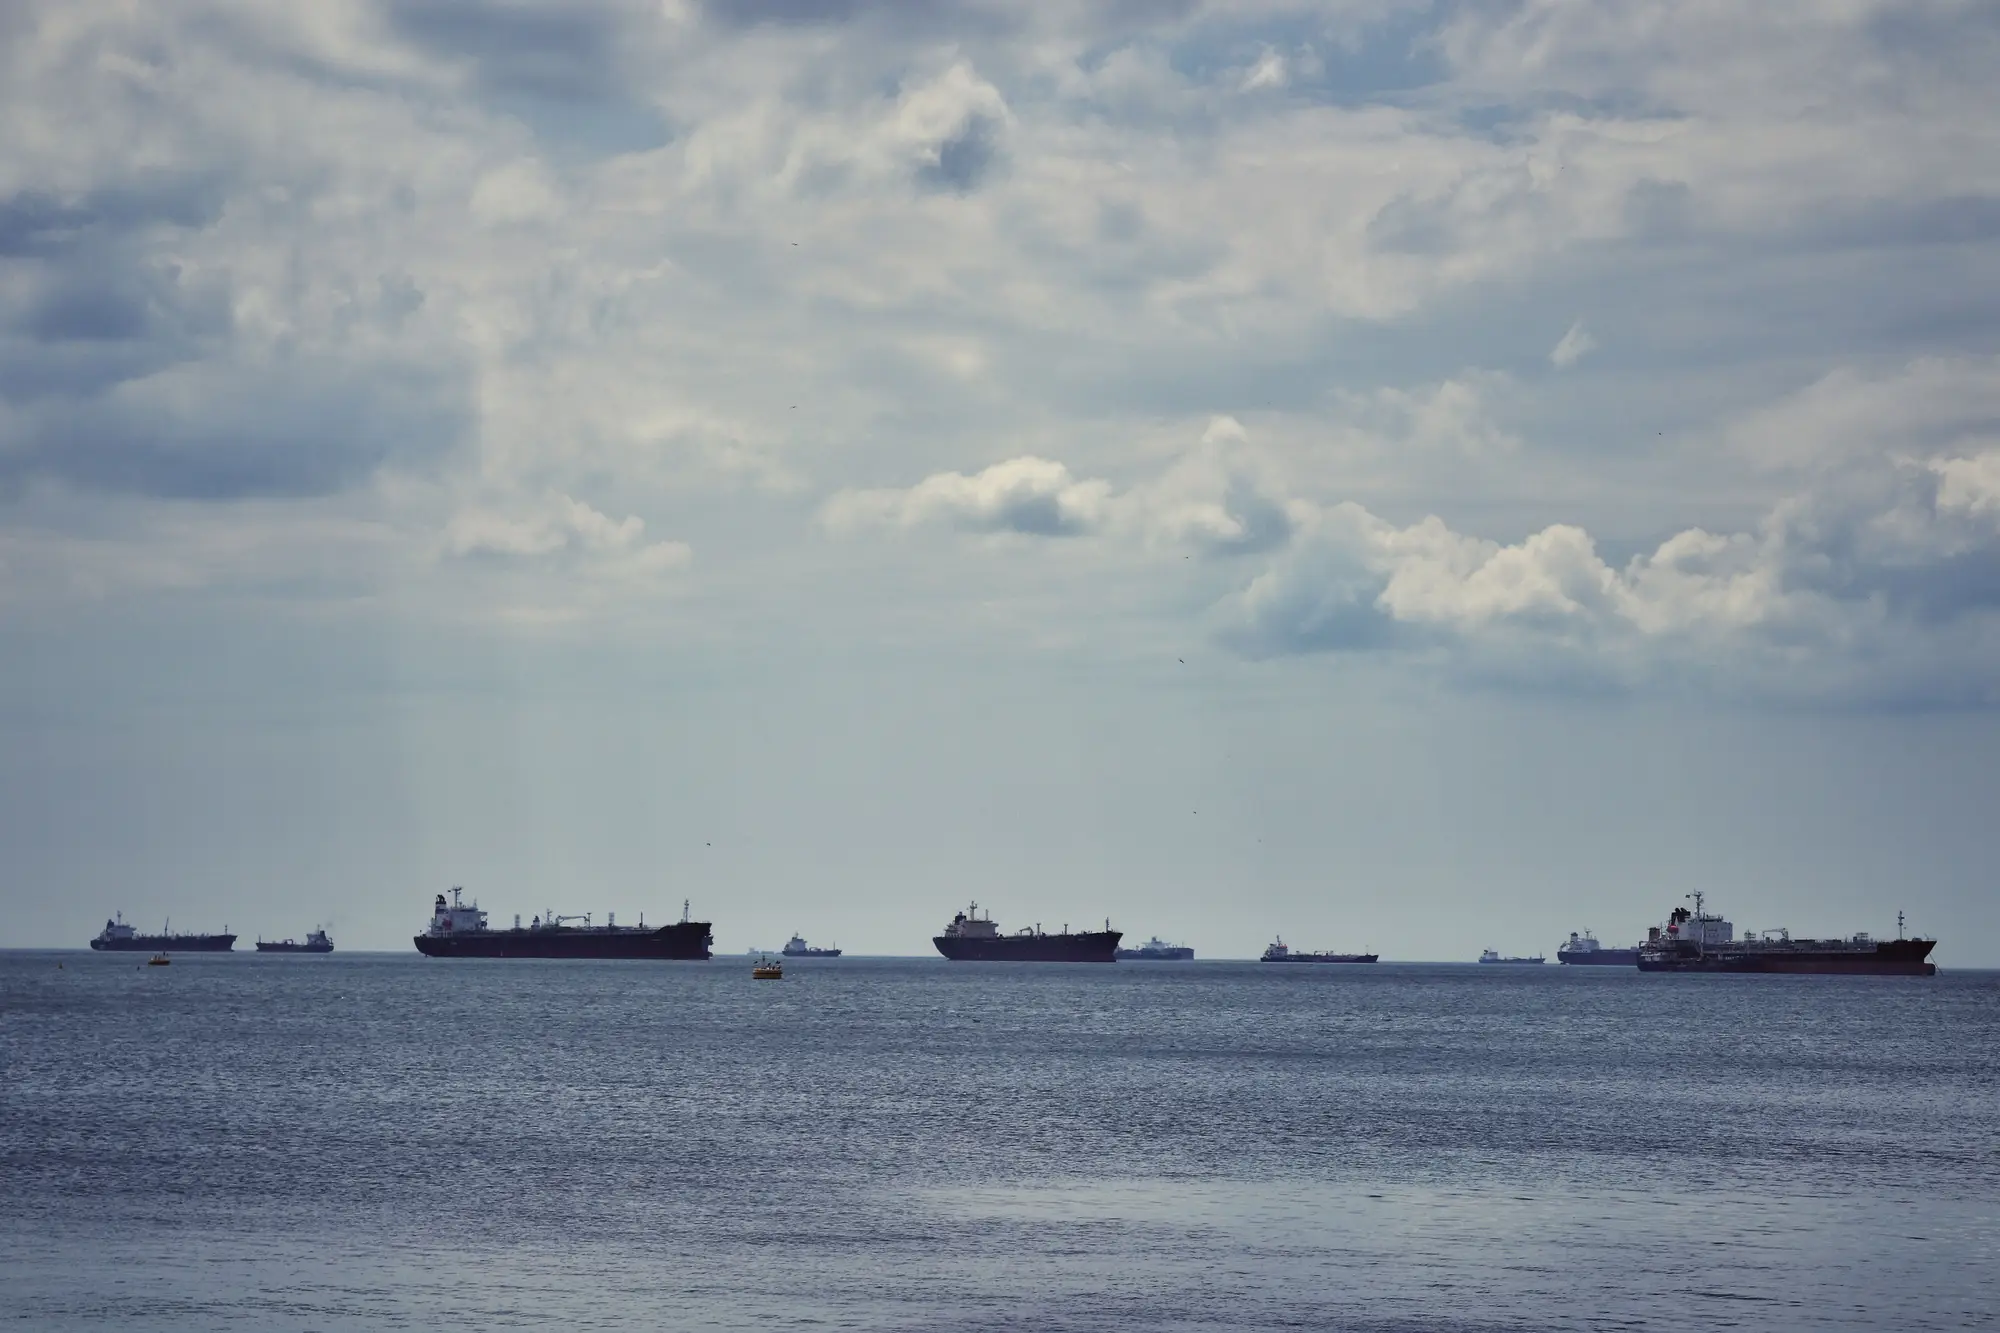
A broker calls to say the anchorage count outside your discharge port jumped from twelve vessels to thirty-one over four days. Your laycan is next week. Is that a typhoon signal clearing a channel, or is the berth genuinely backed up and about to eat into your demurrage? The agent's telex won't tell you for another week, and by then your NOR has already been tendered.
The two situations produce the same headline number. A count spike is a count spike whether it's caused by a storm or a terminal that's fallen behind on discharge rate. What differs is the shape of the thing, and that shape is readable if you're watching the anchorage every day instead of waiting for the next port update.
Why the two look identical on day one
Weather holds and real congestion both start the same way: pilotage gets suspended or slowed, vessels that would normally be working cargo or moving to berth sit tight at anchor instead, and the count climbs. A signal number 8 off a Philippine port, a monsoon depression stalling tanker traffic in the Bay of Bengal, a fog bank closing a river approach in North China. All of it reads as "more boats sitting outside the breakwater than usual" on day one, two, even three.
If you only check the anchorage once, at the moment the broker flags it, you genuinely can't tell the two apart. A static snapshot of thirty-one vessels tells you there's a backlog. It doesn't tell you whether that backlog is weather-driven and temporary or berth-driven and sticky.
The tell is what happens after the weather clears
Weather holds resolve in a burst. Once the port authority lifts the signal or the fog lifts, pilotage resumes and the queue works down fast, usually within a tide cycle or two, because the vessels sitting at anchor weren't competing for a scarce berth. They were just waiting for permission to move. The count that spiked to thirty-one drops back toward the baseline over two or three days and stays down.
A true congestion queue does the opposite. The weather clears, pilotage resumes, and the count barely moves, or it keeps climbing. The underlying constraint is a terminal running behind on discharge rate, a labor action, a crane out of service, or more cargo nominated into the port than the berth plan can absorb in a given week. Weather may have made the queue worse for a few days, but clearing the weather doesn't clear the queue.
The diagnostic is the shape of the series over the following week, not the spike itself. A sharp rise followed by a sharp fall that tracks the published weather signal is a hold. A rise that plateaus, or keeps rising past the point the signal lifts, is a queue you need to plan demurrage around.
There's a secondary tell worth watching too: where the vessels are positioned. Weather holds tend to bunch vessels loosely across the whole anchorage area, since everyone got caught by the same system at roughly the same time, arriving from different directions. A terminal-specific queue tends to show vessels stacking in a tighter cluster closer to the berth they're waiting for, because they arrived over a longer stretch of time for the same underlying reason. That's a softer signal than the count trend itself, but combined with the post-weather shape, it's usually enough to call it.
None of this requires guessing. It requires a daily count, not a one-off check when someone happens to mention the port looks busy. A single data point can't show you a shape. A series can. Port Congestion Watch tracks that daily count at anchorages charterers actually care about, built from repeat high-resolution passes, so you can watch whether a spike clears with the weather or keeps building after it, well before the agent's telex catches up.
If your next laycan runs through a port that's prone to typhoon holds or seasonal fog, it's worth watching the anchorage series now, not after the broker calls.